Final Figure Blues
I've been making a lot of figures recently, in a general rush of paper making as my current postdoc winds down to an end. One of the most annoying parts of writing a paper is making that final graph, the composite image complete with cute little captions that is to be submitted as "Figure".
At this point, you've already created beautiful individual graphs, each carefully proportioned, illustrated, bevelled and perfumed to perfection. But adding one last insult to injury, you must now condense a bunch of graphs into a composite figure, sub-labeled with the appropriate A's, B's and C's.
So you sigh, and reach for Photoshop.
I bet you've been here before. You've loaded all the graphs into a large empty canvas in Photoshop or GIMP. It's then a nightmare of cuting-and-pasting, resizing and layer munging. This is fiddly and boring shit, especially if your computer is not a sexy desktop-publishing beast, where your programs choke on high resolution images. Watch as your 600dpi image follows your mouse like a retarded animal to find that final resting place 30 seconds after you actually moved your hand. Font control is not exactly the most intuitive operation in graphics manipulations program, especially if all you want to do is put one A in the right place at the right size.
Stop. There is a better way.
After years of pain, I finally made myself learn the Python Imaging Library, and lo-and-behold, I quickly hacked together some code that let's me do that last assembly step in Python, even including a precise placement of the labels. Goodbye GIMP. Goodbye Photoshop.
First you need to install PIL. Then you need to find your system font file. This is very important. Without it, you can't make the labels. Once it's installed, in your python script, import the three modules that you will need:
import string, os
import Image, ImageDraw, ImageFont
Resizing is the first thing you need to worry about. PIL provides you with a resizing function that does smoothing. Everything works through an Image object, so here's a function that generates a new Image object resized to a new width:
def im_to_width(im, new_w):
  w, h = im.size
  ratio = w / float(h)
  new_h = int(new_w / ratio)
  return im.resize((new_w, new_h), Image.ANTIALIAS)
Next, you want to stick any smaller image into a bigger image. In this case, I create a helper function that reads straight from an image file (png, or in fact any PIL friendly image formats), and inserts it into an existing Image:
def insert_png(big_im, png, width, coords):
  if width:
    part_im = im_to_width(Image.open(png), int(width))
  else:
    part_im = Image.open(png)
  big_im.paste(part_im, coords)
  del part_im
Finally, I have a function that reads parts (which is a list of smaller images and associated parameters that I will explain below), and constructs a brand new png (or whatever name your image is). If png is actual a '.tiff' file, it will automatically write a .dpi of 300 (which some journals require). Make sure you know where your system fonts are because this function needs to find it to do the labeling. The labeling simply goes from 'A', 'B' .... following the order of the parts.
def construct_plot(
    out_png, parts, width, height,
    label_size=120, label_fill=(0,0,0),
    bg_color="white"):
  im = Image.new("RGB", (width, height), bg_color)
  draw = ImageDraw.Draw(im)
  f = ImageFont.truetype(
    "/Users/bosco/Library/Fonts/Arial", label_size)
  for i, (x, y, w, png, label_x, label_y) in enumerate(parts):
    if not os.path.isfile(png):
      raise IOError("can't find %s" % png)
    insert_png(im, png, w, (x, y))
    s = string.ascii_uppercase[i]
    draw.text((x + label_x, y + label_y), s, font=f, fill=label_fill)
  if out_png.endswith('.tiff'):
    im.save(out_png, dpi=(300,300))
  else:
    im.save(out_png)
So here's how I'd use it. Let's say you have these pngs's:


Okay, we then create a plot, where all the design is embedded in a bunch of parameters:
parts = []
input = """
17fq9.jpg 30 30 270 -15 0
19rh7.jpg 330 30 250 -15 0
7md6.jpg 630 30 270 -15 0
1mn4.jpg 30 380 500 -15 0
9wn0.jpg 580 380 320 -15 0
"""
for l in input.splitlines():
words = l.split()
if len(words):
name = words[0]
x, y, width, label_x, label_y = [int(w) for w in words[1:]]
parts.append((x, y, width, name, label_x, label_y))
plot_width = 930
plot_height = 750
font_size = 15
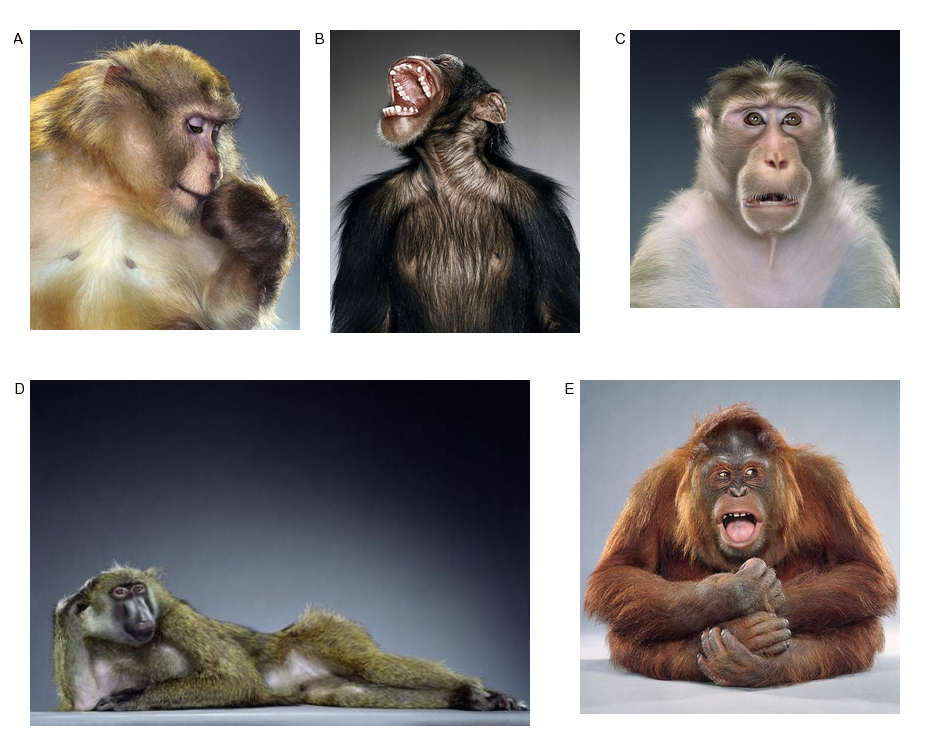
construct_plot('out.png', parts, plot_width,
plot_height, font_size)
Which gives:
On the Mac, you can also add a last line to your script, such as:
import os
os.system('open out.png')
Which will open the image in a Preview window. From here, changing the design is as simple as simple as tweaking the parameters, and re-running the script (here are some published figures that I generated using this method). Photo-editing pain now transformed into elegant number twiddling. You may never have to reach for Photoshop to do figures again. I sure don't.
—
As a bonus, I find that I often like to crop figures. Cropping is a pain in the butt because I have to look up the width and height to calculate the right values to crop. Instead, an easier but less exact way is to use fractions to do decide how much cropping is to be done:
def shrink_png(png, l=0.0, u=0.0, r=1.0, b=1.0):
  im = Image.open(png)
  (abs_l, abs_u, abs_r, abs_b) = im.getbbox()
  im.crop((int(abs_r*l), int(abs_b*u),
               int(abs_r*r), int(abs_b*b))).save(png)